Figure 2.1a shows the
gluon momentum fraction ![]() from our Monte Carlo studies of
the open charm production by photon-gluon fusion
(see par. 3.1.2 of the COMPASS proposal for a description of
Monte Carlo event generators)
integrated over the quasi-real
photon energy spectrum
from our Monte Carlo studies of
the open charm production by photon-gluon fusion
(see par. 3.1.2 of the COMPASS proposal for a description of
Monte Carlo event generators)
integrated over the quasi-real
photon energy spectrum ![]() from 35 to 85 GeV.
The input unpolarized gluon distribution is the Duke-Owens set 1.1 and
from 35 to 85 GeV.
The input unpolarized gluon distribution is the Duke-Owens set 1.1 and
![]() GeV/c
GeV/c ![]() .
Other distributions, like the MRSA, give similar spectra.
The
.
Other distributions, like the MRSA, give similar spectra.
The ![]() distribution is basically a convolution of the unpolarized gluon
distribution with the elementary photon-gluon fusion cross section and the
quasi-real photon spectrum.
In the
distribution is basically a convolution of the unpolarized gluon
distribution with the elementary photon-gluon fusion cross section and the
quasi-real photon spectrum.
In the ![]() range of 35-85 GeV this distribution is peaked at
range of 35-85 GeV this distribution is peaked at
![]() , it starts at
, it starts at ![]() and
extends over
and
extends over ![]() , with a good coverage in the
, with a good coverage in the ![]() region.
According to recent parametrizations,
region.
According to recent parametrizations,
![]() has a maximum in the range of our proposed measurement.
has a maximum in the range of our proposed measurement.
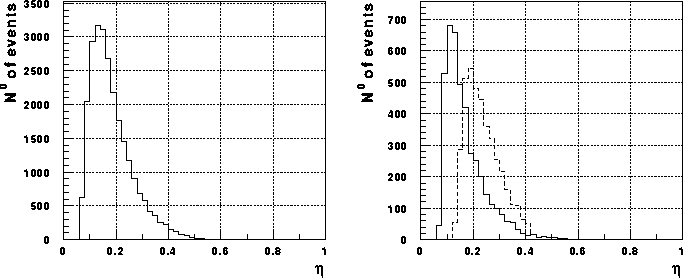
Figure: ![]() distribution of gluons in open charm production:
a)
distribution of gluons in open charm production:
a) ![]() GeV;
b) dashed line
GeV;
b) dashed line ![]() GeV, solid line
GeV, solid line ![]() GeV.
GeV.
With increasing ![]() ,
, ![]() decreases; by splitting
the covered
decreases; by splitting
the covered ![]() interval in smaller
interval in smaller ![]() bins (or using a higher beam
energy as mentioned in the proposal)
we cover different
bins (or using a higher beam
energy as mentioned in the proposal)
we cover different ![]() regions.
Figure 2.1b shows the
regions.
Figure 2.1b shows the ![]() distributions for two different
distributions for two different
![]() bins of 30-45 GeV and 75-90 GeV, respectively.
It can be seen how the low
bins of 30-45 GeV and 75-90 GeV, respectively.
It can be seen how the low ![]() bin covers the high
bin covers the high ![]() region
and is peaked at
region
and is peaked at ![]() while the high
while the high ![]() bin
covers the low
bin
covers the low ![]() region and is peaked at
region and is peaked at ![]() .
By splitting our
.
By splitting our ![]() interval, for instance into 4
interval, for instance into 4 ![]() bins, the
measurement error on the
bins, the
measurement error on the ![]() asymmetry for each single
asymmetry for each single ![]() bin
will increase roughly by a factor of 2,
each
bin
will increase roughly by a factor of 2,
each ![]() bin having now a
bin having now a ![]() .
Such an analysis will also allow us to determine approximately
the
.
Such an analysis will also allow us to determine approximately
the ![]() shape in this
shape in this ![]() range.
range.
It has to be added that the error estimates reported in the proposal were based
on the ![]() decays only
(with and without
decays only
(with and without ![]() tagging).
We can expect a considerable improvement on the
tagging).
We can expect a considerable improvement on the
![]() measurement including other D decay channels,
giving
measurement including other D decay channels,
giving ![]() smaller than 4 %,
and hence a better sensitivity on
smaller than 4 %,
and hence a better sensitivity on ![]() .
.